
Report Analysis
Choose the question you want to answer. Start with a project or JQL in Reports, then follow one of these paths.
Build your analysis
Section titled “Build your analysis”- Expand Group results and choose First dimension.
- Optionally add Second dimension.
- Choose Total, Mean per contributing issue or Median per contributing issue.
- Run report, then select a grouped value to see contributing issues.

Check the scope: one-page totals cover that page only. Choose All search pages to compare the collected population.
- Open Statuses and optional groups → Load statuses from scope.
- For a group, choose Add status group, enter Group name and select Group statuses.
- Choose a metric and its definition below, then run the report.
| Metric | Select |
|---|---|
| Cycle time | Cycle statuses and/or configured groups |
| Lead time | Lead time definition, then completion statuses or statuses to sum |
| Time in status | Included statuses and Repeated status visits |
For example, Development + Review can define a cycle; Blocked + Waiting for Customer can form a Waiting group. Use your own workflow names.
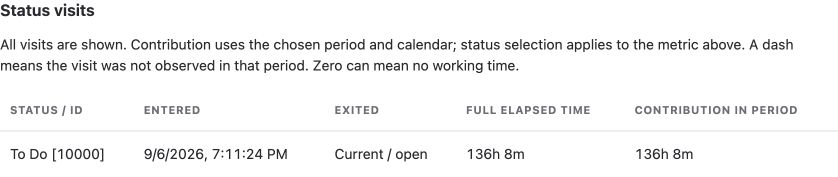
Read the result: visits of 2h and 6h give 8h total, 2h first, 6h latest or 4h average. Save the report to reuse the configuration.
- Under Start with a question, choose a trend or aging question and Use this question.
- Review the project/JQL, calendar and settings below.
- Run report and inspect the contributing issues.
| Report | Configure |
|---|---|
| Status time by period | Status period: week/month; measurement window and statuses |
| Delivery trend | Trend period, cycle/completion statuses and lead-time definition |
| Open work aging | Cycle-start/completion statuses and Minimum cycle age (hours) |
Before comparing: exclude completion statuses from delivery-trend cycle statuses. Reopened issues rejoin delivery trends when completed again. The current period may still be incomplete.
- Select Jira field duration or Jira field value count.
- Choose Jira history field.
- Optionally select Only while issue is in these statuses or configured groups.
- Run report and compare the values.

Supported: priority, single-select, user picker and Sprint. A Client/Vendor field must use a supported type; arbitrary text fields are excluded. Sprint memberships can overlap, so their durations are not additive.
Which metric answers my question?
| To find… | Choose… |
|---|---|
| Time spent in each status | Time in status |
| Workflow loops and rework | Status count or Transition count |
| When a status was entered | First status entrance or Latest status entrance |
| Duration through your workflow | Cycle time or Lead time |
| Where time occurred each week/month | Status time by period |
| Completed work each week/month | Delivery trend |
| Open issues needing attention | Open work aging or Current visit age |
| Ownership by person or status | Assignee time or Assignee by status |
| Changes in a supported Jira field | Jira field duration or Jira field value count |
Inspect the visits behind a value
Choose View history on an issue row. For grouped results, select a value first, then choose View history on a contributor.
Understand the calculation
Section titled “Understand the calculation”Status groups, counts and entrance dates
Use Statuses and optional groups to map your own workflow, such as Waiting or Active work. The repeat-visit rule applies inside each issue and status before grouping. Status groups combine their member values. Do not add overlapping groups together or add a group to its member statuses.
Status count includes the initial status at creation. Transition count is directional; selecting statuses filters destinations. Entrance dates refer to the first or latest observed entrance in the measurement window and remain in issue rows.
Cycle time and lead time
Cycle time sums time in your configured cycle statuses/groups without double-counting overlapping selections. Lead time uses your selected states or creation to the latest completion. If reopened, elapsed lead time continues up to now. Configure completion statuses to match your workflow.
Trends and reopened issues
Status time by period splits a visit across the weeks/months when its time occurred. Delivery trend places completed issues in the period when they entered their current completion block. Reopened issues are excluded until completed again. Review the window and calendar; the current period is still incomplete.
Open work aging
Configure cycle and completion statuses, then set Minimum cycle age (hours). Cycle age starts with entry into the first configured cycle status in the current delivery episode. Current-status age measures only the current visit. Both measure up to now, independently of the history period. One-page reports rank that page; all-pages reports rank the collected issues.
Group totals, averages and missing values
Grouping uses current Jira fields, not historical team membership. Issues with multiple components can appear in multiple groups. Mean and median exclude missing measurements and include measured zeros. The Time in Status summary counts each issue once per metric.
Ownership and Jira field history
Assignee metrics measure elapsed ownership, not logged effort or productivity. For field duration/count, choose a supported field offered by the app. Duration measures how long each value was held; count measures entrances into a value. Only history available from Jira can be measured.